This post completes the lify cycle of a feature flag, describing the rollout process (or how to activate it in production) and the cleanup (to reduce technical debt).
Rollout
Feature flags provide the capability of separating deploy from release. In addition, feature flags contributes in improving the release of new features by enabling safe and secure releases.
Rollout is the process of releasing a new feature and goes from test in production (enabling the feature for beta testers), releasing it for key users or percentage of transactions to fully enable it for all users and all traffic.
Independent on how rollout is performed, one aspect that is key is monitoring behavior, i.e. we want to be able to certify that both deployment and release does not affect our production service.
On top of this, working with toggles in production give us a parachute or handbrake: the kill switch. We are able to deactivate a released feature at any time and immediately.
Phases Of A Feature Launch
Changes to feature flags should be treated as code deploys. I.e, they require approvals for config changes and they need to be properly communicated. Feature Flags offers a bunch of options or phases for the rollout (from less to more exposure):
- Test In Production: Feature is only visible to some internal users (QA or beta testers). The goal is to detect integration bugs, get design feedback or train sales or support teammates on a new feature using production data. Therefore, this step can be quick, a couple of days at best.
- Debugging: Feature is only visible for group of users (key users) or a % of transactions (5-10%). The goal is to detect performance challenges or to measure the impact of the feature.
- Maximum Power Ramp (MPR): Once we are confident the feature is not risky, the goal shifts to decision making, i.e. measure whether the feature is positively impacting the metrics it was designed to improve. Normally, in MPR, visibility is set to 50% of users or transactions (from an experimentation or decision making perspective is the fastest way to gather data on customer impact). It should remain at least a week on this step to collect data across high and low traffic days.
- Scalability: Before we directly ramp to 100% of users, in case there may be performance concerns, we could use the Scalability phase. This phase is used to resolve these operational scalability concerns, setting visibility to 75% and stay there for one day of peak traffic to be confident our system will not topple over.
- Learning: This phase is to understand its long-term impact on users. The idea is to keep a reduced % of users or transactions (5%) without access to the new feature, during a long period of time (at least a month). This holdout set can be used to measure long-term impact, which is useful in some cases. The key thing here is to have clear learning objectives.
Launching a feature requires a series of steps, each with a specific objective. Test In Production phase is for internal feedback, debugging and scalability phases are meant for risk mitigation, while MPR and learning phase are meant to speed up learning and decision-making.
Increasing exposure to a feature (rollout phases) should not affect the current exposed population. Users should consistently have the same experience.
Not all features will pass all these phases. In fact, for most of the features, having a suitable monitoring, these phases won’t be executed and feature will be rolled out to 100% in one step, just checking feedback obtained from the feature flag.
Monitor Your Feature Flags
We need to obtain feedback from our features, it is key that we are able to see the effect of making a change in a toggle. We need to measure the impact they have in our production system.
When working with feature flags we operate within a feedback loop. We make changes, observe the effects, and use those observations to decide what change to make next.
Feature Telemetry
We need to integrate to our analytics and instrumentation systems from the beginning.
Information will be composed by:
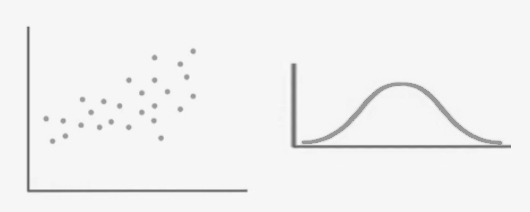
- System metrics: Common to all services. These metrics guides you detecting what has failed: is it a bug? A lack of resources? Some dependency failing? Examples of system metrics are: CPU and memory consumption, 99% of response times, % of errors…
- KPI: Business metrics, defined by the company or team/product. They tell us whether our system is behaving as expected.
Correlating Changes with Effects
To observe the effects of a feature-flag change, we need to be able to correlate the change with its effects, closing the feedback loop. Correlation is the key. If we apply an A/B test and see 50% of users converting more but do not know which users saw which treatment, we are unable to make sound decisions.
Continuous Deployment essentially produces micro-launches all the time as engineers constantly push new features into production. The impact of small changes is difficult to measure if the metrics are not directly tied to the feature.

We can identify/relate measured metrics by:
Inference
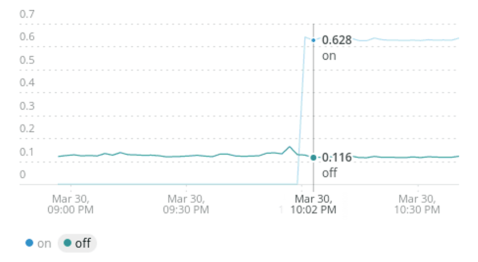
Identifying in the time series when flag has been modified. This approach enables correlation in most simple scenarios but has some drawbacks. In the case of a 50% feature roll out, it will be difficult to know which effect is caused by the flag being on and which by it being off. It is also more difficult to draw correlations when the impact of a feature flag takes some time (for example a change that causes a slow memory leak).
Causality
A more sophisticated approach is to include contextual information about feature-flag state within an analytics event. This approach ties metrics to a feature flag to measure the specific impact of each change. This allows a much richer correlation, as you can easily segment your analytics based on flag state to detect significant changes in behavior. It establishes a feedback loop from the end user back to development and test teams for feature iteration and quality control.
Telemetry
Telemetry can be defined as test and debug in production. Metrics can be used to drive our developments and to define alerts.
We could have an operations flag to regulate how heavily we sample our telemetry. In case of incident: tweak the flag!
It is a good practice to have defined metrics and KPIs before starting development. In this way, we ensure that these metrics are taken into account in the development (they are measured) and testing (they are checked).
These metrics can be used in the deployment to certify that new code behaves as expected (from the point of view of metrics and KPIs), directly checking the rollout using canary deployment technique.
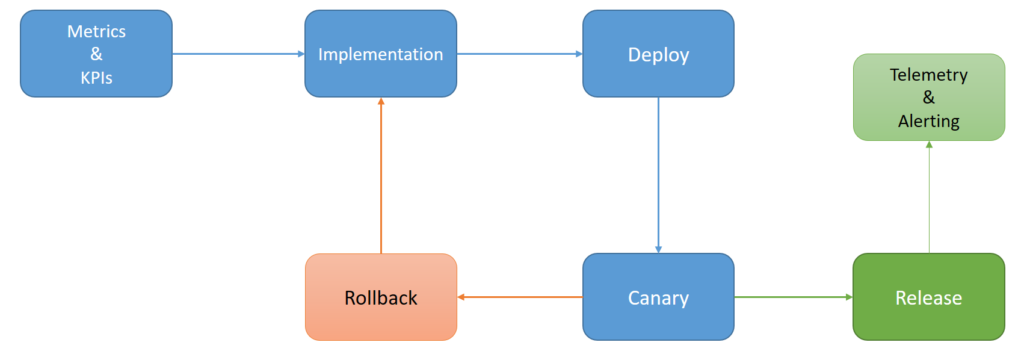
Having metrics and KPIs defined, we can define alerts.
Alerts
Alerts are checks or tests in production. They can be:
- Health check based: ping, smoke check (are required services reachable?), …
- Threshold based: maximum response time allowed
- Trend based: number of errors allowed in a period of time
Runbook
With alerts, we can create a runbook. A runbook tries to identify patterns or symptoms before alerts, and possible solutions. Any time that there is an outage (or just alerts triggered and fixed after some intervention), runbook is updated describing the symptoms, which alerts were triggered and list of actions (any action performed and its result), including those that did not solve the problem.
A runbook can be helpful next time that same alerts are triggered.
Kill Switch
When we detect that something is going wrong in production, we need to identify whether it is a random or external behavior (peak in requests, increase of traffic, …) or caused by a feature flag.
In case we confirm that cause is a feature flag and, after deep analysis, we reach the conclusion that severity is high enough that we want to revert last deployment… we just have to open the parachute: deactivate the feature flag.
It is not a rollback, does not require code revision to decide which of the last changes should be reverted and does not require a rollback and it is immediate, it is a kill switch!
Cleanup
While each active feature flag in our system delivers some benefit, each flag also comes with a cost. A flagged code is harder to understand, and harder to modify.
Therefore, we generally just used an if/else in all places that rely on the flag, knowing that the ‘else’ branch will be removed shortly.
Removing flags when appropriate avoids technical debt and complexity that can make your code fragile, harder to test and more difficult to support.
In case of release feature flag, once toggle has been rolled out (released for all users), we have to determine when to clean it up. There is no standard way, the idea is to define a kind of expiration date (or cleaning date), by adding a task to the backlog or adding a tag or label to the feature flag, …
Cleaning a flag means removing old code, old tests and deleting the flag.
Key Takeaways
- Feature flags are a valuable technique to deliver better, more reliable software faster
- Feature flags can be used for both release management (dark launches, canary rollouts, betas) as well as long term control (entitlement management, user segmentation personalization)
- Feature flags need to be managed properly with visibility and control to engineering
- If not managed properly, feature flags can be very destructive technical debt
- The true power of feature flags is to allow business users access to code control by separating deployment from visibility
References
- The Split Blog
- Feature Toggles (aka Feature Flags)
- A Practical Guide to Testing in DevOps, by Katrina Clokie
- Feature Flag Best Practices, by Pete Hodgson & Patricio Echagüe
- Managing Feature Flags, by Adil Aijaz and Patricio Echagüe